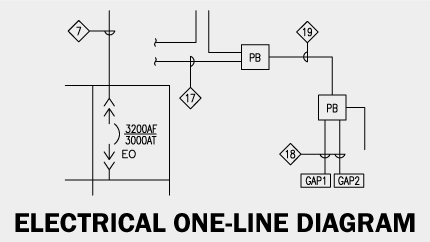
A one-line diagram is a symbolic representation of an electrical system, showing all the components and their interconnections in a single line.
To read a one-line or single-line diagram, start from the top left side at the highest voltage and work your way down to the lowest voltage. This helps you keep track of the voltage drops and gains throughout the system. Then, you can look for symbols that represent different components, such as switches, transformers, and motors.
Reading a one-line diagram for power distribution is essential for anyone working in the power industry. In this article, our team of experts at Bay Power explains how to read these diagrams, covering issues such as symbol conventions, basic topology diagrams, and other essential elements. Keep reading to learn more.
Understanding The Terminology Used In One-Line Diagrams
A one-line or single-line diagram is an essential means of communication and represents an electrical power system. It's a simplified depiction of an electrical distribution system's various components, including sources, loads, conductor paths, and protection devices like fuses, circuit breakers, and relays.
Symbol conventions
The symbols used in one-line diagrams are standardized and represent different electrical system components. For example, a circle with an X inside represents a switch, while a triangle with an arrow pointing up or down indicates a transformer. Other symbols include rectangles for motors, squares for resistors, and diamonds for capacitors.
Additionally, the lines connecting the symbols represent conductors, and the arrows indicate the direction of the current flow.
How To Interpret Electrical Parameters On The One-Line Diagram
Interpreting electrical parameters on a one-line diagram is essential for understanding the power system. The most common parameters are voltage, current, and power.
Voltage
Voltage is represented by the number of lines connecting two symbols, each representing a certain voltage level. It is indicated at the top left of the diagram and is usually expressed in volts (V) or kilovolts (kV).
The voltage may drop or increase depending on resistors, capacitors, and other components. In those cases, you can see the voltage drop or gain indicated by a number next to the line.
Current
Current is represented by the thickness of the lines connecting two symbols. It is indicated throughout the diagram and is usually expressed in amperes (A).
Power
Power is represented by a combination of voltage and current. It is indicated at the bottom left of the diagram and is usually expressed in watts (W).
Other Electrical Parameters
Other electrical parameters on one-line diagrams include frequency, phase angle, power factor, and more.
Here is an overview of the most common symbols:
- Frequency—represented by a number next to the symbol and is usually expressed in hertz (Hz).
- Phase angle—represented by an arrow pointing up or down next to the line and is usually expressed in degrees (°).
- Power factor—represented by a number next to the line and is usually expressed as a decimal (e.g., 0.8).
- Transformer—represented by a triangle with an arrow pointing up or down.
- Circuit breaker—represented by a circle with an X inside it.
- Fuse—looks like an actual fuse.
- Bus Duct—for low and medium voltage bus ducts.
- Ground (Earth)—represents the grounding point.
- Battery—shows a battery in the equipment.
- Motor—shown as an empty circle or with an M inside.
- NO Contact—normally open contact.
- NC Contact—normally closed contact.
Generating a protective device report from a one-line diagram is essential in understanding the power system. This report provides information about the protective devices used to protect the system from overloads and short circuits, such as circuit breakers and fuses.
First, to generate this report, identify all protective devices on the one-line diagram. A circle with an X inside it is typically used to represent these. Once you have identified all the protective devices, you can generate a report that includes information such as the type of device, its rating, and its location in the system.
Once you have generated the protective device report, you can use it to determine if the system is adequately protected. You can also use it to identify potential problems from an overload or short circuit. Additionally, you can use the report to plan for future upgrades and expansions of the power system.
Finally, it is essential to remember that one-line diagrams represent the power system and should not be used as a substitute for actual measurements.
Final Thoughts
Reading one-line diagrams is essential for understanding electrical power systems. By familiarizing yourself with the symbols representing different components and parameters, you can interpret the diagram and generate a protective device report. You can then use this report to troubleshoot the system or plan for upgrades.
Contact Bay Power today if you need help replacing a failed electrical component. We have thousands of parts in inventory ready for pickup or shipment today.